- Racket Business
- Posts
- Tennis Participation 2026
Tennis Participation 2026
Gary Horvath sees encouraging information, tough questions, and challenging opportunities.
Gary Horvath
February 28, 2026

The recently released 2026 annual tennis participation report conducted by Sports Marketing Surveys USA provided its usual insight into the evolving tennis industry. In many ways, 2025 was a banner year. At the same time, caution flags were raised in several areas.
The 2026 report also included a timely twist. It reported that participation in six racquet sports was about the same or greater in 2025 than at the beginning of the COVID-era (2020 to 2025). This supports the theory that the growth in tennis is a function of the increase in the U.S. population, access to the existing tennis infrastructure, the decisions by RSPA and PTR to certify professionals in other racquet sports, the recently developed pickleball industry, and the enthusiasm that has been created for racquet sports in general.
Enthusiasm for Racquet Sports Increased – Even Racquetball Increased!
You know it is a racquet sports boom when racquetball participation increases! Between 2020 and 2025, participation rose by 300,000 participants (Table I).
During the COVID era, many prognosticators forecasted that pickleball would return to irrelevancy, much as racquetball had done during the 1980s. In an unprecedented manner, investors created pickleball facilities, a pro circuit was organized, there was television coverage, and pickleball teaching professionals were certified. In 2026, many of the same prognosticators are speculating that the number of pickleball players will exceed tennis participation in 2026.
In 2025, participation in padel was measured for the first time. There were 1.1 million participants. Misitrano Consulting produced a state-of-the-industry report in late 2025 stating the United States had 800 padel courts at 220 locations in 31 states. Click https://www.misitranoconsulting.com/us-padel-report for access to the full report.

Demographics – Sex, Race/Ethnicity, Income, and Age
Tennis demographics (sex, race/ethnicity, income, and age) are important to marketers, manufacturers, owners, investors, and government policy makers. Tennis demographics have evolved slowly in conjunction with changes in the U.S. population, government policy, media coverage, and industry marketing and programming.
Sex - Tennis has typically had a greater percentage of male players than the general population. The mix in the tennis population is 56% male and 44% female. The Census Bureau reports a breakdown of 49.5% male and 50.5% female. Tennis has a disproportionate percentage of male players.
Race and Ethnicity (Tables II and III) - About 54% of tennis players are white. The change in the white tennis population plateaued between 2016 and 2019; it rose significantly in 2020 and has been relatively flat since then. The Hispanic population began increasing in 2019, and the Black and Asian Pacific Islander population started increasing in 2020. All other races and ethnicities began increasing in 2021.

The participation report underrepresents the mix of whites and Hispanics in the U.S. population. These two groups account for about 77.5% of the U.S. population (Census) and 72.5% of tennis participants (report).

Income - The data in Table IV show that the general population has a higher percentage of people with incomes below $50,000 per year than the tennis population. Additionally, the general population has a smaller percentage of individuals with an income greater than $50,000 compared to the tennis population.

The amount of the household income varies by race or ethnicity, as defined by the Census Bureau (2024):
All races, $83,730
White alone, not Hispanic, $92,530
Black alone, or in combination, $56,020
Asian alone, or in combination, $120,900
Hispanic, any race, $70,950.
Age Groups - The report provides the level of participation for seven different age groups. This analysis combines the data into four age groups (Table V and Table VI). Key takeaways follow:
The Juniors group featured players from 6 to 17 years, a total of 12 years. In 2025, the Juniors group was the second largest, with 6.5 million participants. For this period, it increased by 1.9 million, a CAGR of 3.9%. There was a significant jump in participation in 2020. Census projections suggest there will be slower growth in the number of juniors resulting from lower fertility rates. After 2021, junior participation has remained steady.
The Transition category included players from 18 to 24 years, a total of seven years. In 2025, the group had the smallest number of participants, 3.4 million. During this period, it increased by 900,000, a CAGR of 3.5%.
The Prime Age group covers the 30 years from 25 to 54 years. In 2025, the category was the largest with 12.4 million. For this period, it increased by 3.2 million, a CAGR of 3.4%.
Finally, the Senior group covers all players over the age of 55. In 2016, the group had 1.9 million players. It increased to 5.0 million in 2025. There was an increase of 3.1 million players, a CAGR of 11.4% (calculated for 10 years). The high rate of growth in 2020 and beyond is most likely a result of the aging of the baby boomers.
Total growth for this period was 9.2 million participants, a CAGR of 4.7%.

The analysis below shows that each category increased between 2016 and 2025. The share of the senior group increased from 10.5% to 18.3%, while the percentage of the other three groups decreased. This illustrates that tennis is truly a sport for a lifetime (Good news!) It remains to be seen how participation by age group changes when the baby boomers work through the cycle.

One of the most important report metrics is the location where participants play. About 65% of tennis athletes play in public parks, at schools or colleges, or in recreation centers. About 17% play at private tennis clubs or country clubs. The remaining 18% play at private courts, apartments, and other venues.

Frequency of Play
Another critical metric is the frequency of play.
In 2025, there were 27.3 million people aged 6 and older who played tennis at least once a year. Their frequency of play follows:
Casual (1 to 3 times per year) – 6.9 million players fall in this category (25.3%)
Occasional (4 to 9 times per year) – 6.0 million players are in this group (22.0%)
Frequent (10 to 20 times per year) – 6.9 million players play frequently (24.5%)
Regular (21 to 49 times per year) – 4.0 million players play regularly (14.7%)
Avid (50+ times per year) – 3.8 million are avid players (13.9%).
By definition, core players (Table VIII and IX) play tennis at least ten times annually (Frequent, Regular, and Avid). They are important to the industry because they buy tennis goods and services.

On average, about 51% of adults are core players, and 59% of juniors are core players. Over time, the percentage of adult core players has decreased, and the percentage of junior core players has been volatile.

Some industry leaders feel the definition of core should be more restrictive (Table X). Their view of the industry is that the participation categories that matter the most are “hard core” players (avid + regular).

Play Occasions
Play occasions are defined as the number of times participants played in a year (Table XI). The frequency of play data can be used to estimate the number of play occasions. After declining from 2016 to 2019, play occasions have posted strong gains.
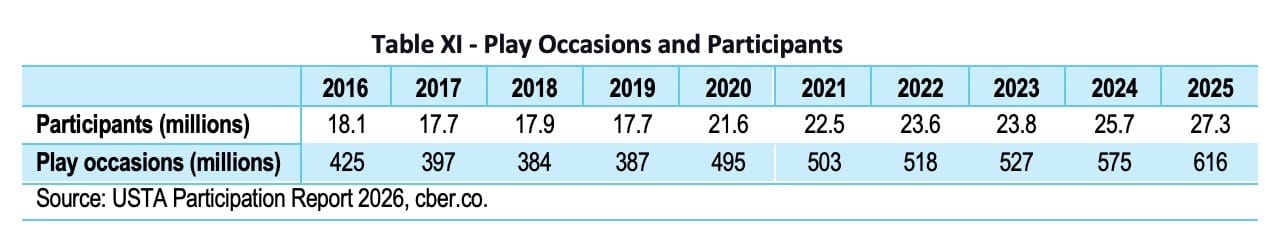
At a micro-level, play occasions can be used to understand the facility utilization and whether there is demand for facilities or other opportunities to generate additional revenue. At a macro level, play occasions are more specific than participation numbers because they measure the level of participant activity. This measure should correlate with participant spending. Over time, the average number of annual play occasions per player for tennis participants is about 22.
The relationship between the frequency of play (five levels of participation) and the number of play occasions is described below.
Casual (1-3 times) The casual category has 6.9 million participants, or 25.1% of the tennis population. The players in this category account for 3.4% of total play occasions.
Occasional (4-9 times) The occasional category has 6.0 million participants, or 21.9% of the tennis population. These participants account for 8.8% of total play occasions.
Note: Casual and occasional players account for 12.9 million participants, or 47.0% of the tennis population. They account for 12.2% of total play occasions.
Regular (10-20 times) The regular category has 6.7 million participants, or 24.4% of the tennis population. They account for 21.8% of play occasions.
Frequent (21-49 times) There are 4.0 million frequent participants, or 14.7% of the tennis population. They account for about 32.1% of the total play occasions.
Avid (50+ times) There are 3.8 avid participants, or 13.9% of the tennis population. They account for about 33.9% of play occasions.
Note: “Hard core” players account for 7.8 million players, or 28.6% of the tennis population. They account for almost two-thirds of all play occasions. Core players account for 14.5 million players, or 52.7% of the tennis population. They participate in 87.8% of play occasions.
Key Points - What’s Next?
The 2026 report supported those who believe the industry had solid participation growth in 2025.
There was solid growth in tennis and pickleball. Participation in padel was measured for the first time in the U.S. Has the presence of pickleball sustained interest in tennis beyond the COVID tennis boom? Looking forward, how will the popularity of other racquet sports affect tennis participation and the consumption of tennis goods and services?
The increase in the U.S. population is partly responsible for the growth of the industry. Data from the Census Bureau shows the U.S. population increased by 1.9 million in 2022, 2.8 million in 2023, and 3.3 million in 2024. Changes in immigration policy may result in slower U.S. population growth in 2025 and 2026. In addition, there are changes in the demographic composition of the U.S. population. How will the tennis industry adapt to those and other demographic changes over the next decade?
The most popular facilities for people to play tennis are parks, schools, colleges, and recreation centers. About 65% of tennis participants identified those facilities as their primary place to play. About 17% play at country clubs or tennis clubs, and the remainder play at other venues. What is the industry doing to strengthen the support for tennis at the parks, schools, and colleges?
The level of junior tennis participation is exceptional despite lower fertility rates that have reduced the number of people in the 6-to-17-year age range. Junior participation has increased. What has the industry done to attract juniors? Will that success continue in 2026 and beyond?
The data by age shows that senior tennis has an abundance of baby boomers, an illustration that tennis is a sport for a lifetime. Will the remaining boomers be replaced by Gen Xers and Millennials?
Data also shows that participation for white players has been stagnant, and there was slight growth in other races and ethnicities. While it is important to target all races and ethnicities, will the industry make a stronger effort to target the white population, since it is the sport’s primary market?
There was increased total tennis participation, core participation, and “hard-core” participation. Is it possible to generate more interest in the 47% of the tennis population that are casual and occasional players?
“Hard core” tennis players drive the industry. The “hard core” players are about 29% of the tennis population, but they account for two-thirds of all play occasions. Will their enthusiasm for tennis remain high with the emphasis on multiple racquet sports?
In closing, the 2026 participation report included encouraging information, tough questions, and challenging opportunities. The recent leadership changes in the RSPA, PTR, and USTA have created an opportunity for the new leaders to make their organizations more effective and to cooperate in building on the industry’s strengths, addressing opportunities, and answering the tough questions presented by the data in the 2026 report.
 Gary Horvath | Gary Horvath is a USPTA master pro, founder, and past president of the USA Professional Platform Tennis Association, a charter member of PPTR, a certified coach with USA Volleyball, and a long-standing member of the Wilson Advisory Staff. His experience as a tennis pro has covered the entire spectrum from grassroots to college tennis. |
In addition, Gary Horvath has conducted extensive business and economic research that has largely supported the state of Colorado's economic development efforts.