- Racket Business
- Posts
- The 2025 Tennis Participation Report - Mixed Reviews
The 2025 Tennis Participation Report - Mixed Reviews
Gary Horvath: The outlook for the tennis industry is generally upbeat.
Gary Horvath
July 28, 2025

The 2025 Tennis Participation Report - Mixed Reviews
The tennis industry has enjoyed two significant increases in tennis participation since 1970. The first boom occurred after the Battle of the Sexes in 1973 and the implementation of Title IX in 1972. The second surge was a result of the implementation of COVID-related policies in 2020. Tennis, pickleball, and other racquet sports were the beneficiaries.
Neither growth spurt occurred due to intentional industry promotional efforts or programs; however, the industry has embraced competition from other racquet sports with a mindset of “growing the size of the pie,” rather than a zero-sum game with winners and losers. If the USTA statistics are a valid and reliable measure of tennis participation, then the good news is that five years after the COVID-19-induced spike, tennis participation is still increasing.
Survey Methodology
Sports Marketing Surveys USA (SMS) conducted the 2024 research used for the 2025 USTA Participation Report. The USTA and the National Golf Foundation partnered to fund the survey. The data is from two sets of surveys. Each has a sample size of 18,000 and only includes individuals 6 years and older.
A critical part of the survey is the categorization of players based on their frequency of play into one of the following categories:
Casual (1 to 3 times per year)
Occasional (4 to 9 times per year)
Frequent (10 to 20 times per year)
Regular (21 to 49 times per year)
Avid (50+ times per year).
SMS determined that core players play tennis at least ten times annually (Frequent, Regular, or Avid). Industry members might have a more rigorous definition.
About 25.7 million people 6 years or older played tennis at least once in 2024. This number defines the overall participation for marketing purposes.
There were 13.0 million core players. That number is valuable for understanding the demand for tennis for business planning purposes. The core players drive the industry!
Demographics
Tennis demographics are important to marketers and policy makers. Over the years, tennis demographics have evolved, in conjunction with changes in the U.S. population.
Many view tennis as an elite sport. A majority of the players are white, male, and have above-average incomes. That is a description, not a criticism.
There are challenges and benefits to being the sport of kings. The issue is not whether the sport is elite. It must promote tennis to a broader audience to increase participation.
Sex
Less than half of the U.S. population is male, yet about 57.0% of tennis players are male (Table I). Industry leaders are well-positioned to further engage women in the industry as players and teaching professionals.

Race and Ethnicity
The data in Table II shows that 56.0% of tennis players are white non-Hispanic.
Over the past decade, the U.S. population has become more diverse. The primary reason is that the fertility rate for whites has been lower than that of other races and ethnicities. That trend is likely to continue.
In 2020, COVID-19-related policies extended the sphere of influence for the tennis industry. Newcomers played tennis because it was an activity that complied with social distancing specifications.
The data in Table II suggest that Hispanics, whites, and the "other category" were underrepresented when comparing the 2024 tennis population and the Census data.

Income
The data in Table III show that the general population has a higher percentage of people with income less than $50,000 per year than the tennis population (31.3% vs 21.0%). In addition, the general population has a smaller percentage of people with income greater than $50,000 than the tennis population (12.1% vs 16.0%).

Player Activity – Frequency of Play, Core Players, and Favored Locations of Play
Total Participation
The most important people in the tennis industry are the players. Without them, tennis would not exist.
After a decade of stagnant participation, tennis participation and the appeal of other racquet sports increased in 2020 because of COVID-19-related mandates.
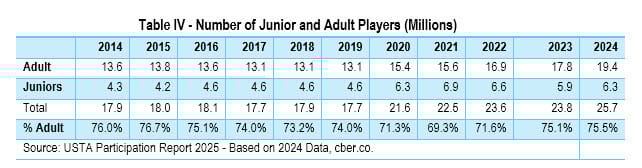
In 2020, the adult tennis population increased by about 2.3 million, and the junior population added 1.7 million players (Table IV). Since then, the number of juniors has been volatile (range of 5.9 million to 6.9 million). The number of junior players in 2024 was the same as in 2020. The number of adults increased by 4.0 million from 2020 to 2024.
Core Players
Core players are the lifeblood of the sport. Overall, about half of all players are core players. They play tennis at least ten times a year. They buy racquets, sneakers, clothing, balls, and strings. They take lessons and play in tournaments and leagues.
Between 2014 and 2024, the total number of players increased from 17.9 million to 25.7 million, a gain of 7.8 million (Table V). The number of core players increased from 9.9 million to 13.0 million, a gain of 3.1 million. While the number of core players has increased, the share of core players has decreased.

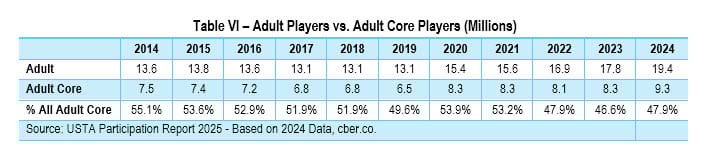
The data in Table VI shows that the number of adult core players increased from 7.5 million in 2014 to 9.3 million in 2024, an increase of 1.8 million adult core players.
During this period, the number of adult players increased from 13.6 million to 19.4 million (an increase of 5.8 million players). Despite the significant increase in adult players, the percentage of core adult players declined from 55.1% to 47.9%.
Typically, the percentage of junior core players has been consistent. Before 2020, the average number of junior core players was about 2.7 million. After 2019, the number of junior core players increased and was more volatile (3.3 million to 3.9 million). There were 3.7 million junior core players in 2024.
About 59% of juniors were core players, except during the peak of the pandemic in 2020 and 2021 (Table VII). The rate was 52% to 55% during those years.

Primary Location Where Participants Play
Seven out of ten tennis athletes play tennis in public parks, at schools or colleges, or at recreation centers.
About 17% play at private tennis clubs or country clubs. The remaining 13% play at other private courts, apartments, and other venues.

Tennis participation by USTA Sections
There are six takeaways from the review of tennis participation for the sixteen USTA sections (Table IX)
There has not been broad-based growth in the tennis industry for the past two years. There was virtually no change in the tennis population for nine sections.
In 2023 and 2024, the tennis population increased by 2.1 million players. It increased by a total of 2.2 million in the Midwest, Southern, Texas, Eastern, Mid-Atlantic, Southern California, and Missouri Valley sections. The 2024 tennis population in these seven sections was 17.2 million.
Tennis participation in the six sections in the Sunbelt (highlighted in orange) had a tennis population of 11.7 million in 2024. Participation increased by 1.0 million in 2023 and 2024. In the past, there was stronger growth in these states.
Florida was in a holding pattern for this period, although its population increased by 1.7 million from 2021 to 2024 and by almost 1.0 million in 2023 and 2024. Despite the increased population during these years, the tennis population was flat.
Several Midwest states experienced out-migration through 2022. That trend reversed in 2023. The tennis population increased by 700,000 in 2023 and 2024.
In 2023 and 2024, the Intermountain Section lost 100,000 tennis players. The population of the section increased by 390,000 during those years. It increased by 750,000 for the years 2021 through 2024.

Essential Issues
The outlook for the tennis industry is generally upbeat. There are opportunities to leverage the industry’s strengths and build on them. Likewise, it is essential to address the challenges facing the industry.
All tennis market segments are essential. Over 70% of the players enjoy tennis at parks, schools, colleges, and recreation centers. Professionals and resources are needed to improve the tennis experience for players in these market segments.
On average, the retention rate for players is 75% to 80%. Annually, five to six million tennis players are lost. Each year, about two million players return after time off, and at least four million new players take up the sport.
Core-tennis players matter! The industry will be more stable with a greater number of core tennis players.
Increased participation is more prominent in Sunbelt states. Growth occurs more frequently in USTA sections with a larger number of participants. Sections with a larger critical mass seem to be more prosperous.
The tennis industry did not adopt a zero-sum approach when pickleball, padel, and platform tennis increased in popularity. Instead, the mindset to make the pie bigger seems to have been a judicious response. As a result, participation has increased, but at a lower level. Some believe that the growth of other racquet sports has helped maintain interest in tennis.
There are pros and cons to being an “elite” sport.
Demographic changes do not take place overnight. Population characteristics will change as a result of lower fertility rates, aging Baby Boomers, migration, or government policies.
Overall, the female population has a faster growth rate than the male population. Over time, the labor force participation rate has increased for women, while it has decreased for men. There is a higher percentage of women with college degrees than men. There has never been a better time to engage more women in tennis as players or teaching professionals.
 Gary Horvath | Gary Horvath is a USPTA master pro, founder, and past president of the USA Professional Platform Tennis Association, a charter member of PPTR, a certified coach with USA Volleyball, and a long-standing member of the Wilson Advisory Staff. His experience as a tennis pro has covered the entire spectrum from grassroots to college tennis. |
In addition, Gary Horvath has conducted extensive business and economic research that has largely supported the state of Colorado's economic development efforts.